Assets, Location & Risk
Every Site You Hold,
Fully Understood
Three questions decide whether a site is worth lending on, insuring or trading from. What the asset is, where it sits, and what threatens it. ALR answers all three at property level, from a data chain Riskscape owns end to end.You do not need a portfolio to start. Point ALR at any neighbourhood, suburb, catchment or proposed site and get the full location read. It covers demographics, spending power, property market, competing brands and the gaps between them.
One address. Three layers of answer.
Most risk tools return a hazard score and stop. A hazard score is not a decision. To price a premium, size a bond or site a store, you also need to know what the building actually is and what surrounds it. ALR is therefore built as three connected tiers rather than a peril catalogue.
From the smallest pixel up.
Riskscape starts at the bottom. The smallest observable unit is a 2 m pixel, and everything is built upwards from there. Every area figure is the sum of real observations, computed once and consistent at every level built from it. A boundary you draw yourself therefore still returns real numbers.
Most providers work the other way round
They start with a national or global dataset and disaggregate downwards, so the figure at your address is a share of a coarse average. Riskscape does not build data that way.
Redraw a boundary and the answer still holds, because the measurements underneath it do not move. Draw a radius or your own catchment and ALR resolves it to the neighbourhoods inside it.
It is the reason penetration, custom trade areas and concentration zones can be trusted. All three depend on the numbers underneath a boundary being measured rather than apportioned.
- 2 m pixel2 msource↓ Everything below is built from here
- Stand / erfmillionsstands
- Neighbourhood~130 000areas
- Subplace / suburb~25 000areas
- City / town~1 500areas
- Municipality213areas
- Province9areas
Sites, networks or your whole book.
An asset is whatever you need to see on a map. An insured building, a bonded property, a bank branch, a franchise outlet, a depot, or the address of every customer on your book. Your own network and your competitors' sit on the same map.
A single address
Branches, stores, outlets
Every customer you have
Coordinates are not required. A spreadsheet of addresses is enough. Every ALR account comes with access to Riskscape's bulk geocoder, which matches your list against Riskscape's own address database and returns clean coordinates, standardised addresses, SG21 property keys and a confidence band per record. No GIS or spatial knowledge required.
Two very different questions. One dataset.
ALR serves the risk desk and the expansion team from the same underlying intelligence. The property a lender is pricing is the property a retailer is trading next to.
Trade area, for retailers and franchise networks
- Whole branch or franchise network on one map
- Loyalty base mapped and measured by neighbourhood
- Catchment demographics and spend capacity
- Competitor presence and category gaps
- Area of influence and cannibalisation per outlet
- Gross leasable area estimation
Risk-first, for banks, insurers and property owners
- IFRS S2 physical risk disclosure
- Probable Maximum Loss (PML), accumulation and concentration limits
- Mortgage book flood and fire exposure
- Premium loading at site level
- Downturn loan-to-value and collateral stress
- Whole customer book scored and mapped
From an address list to a decision.
Start with whatever you have. Most portfolios arrive as a spreadsheet. The same governed figures then reach you three ways, whether a relationship manager pulls one address live in a client meeting or a decisioning engine scores ten thousand overnight.
Bulk geocoder
Start with a spreadsheet of addresses, from ten sites to half a million customers. Coordinates, property keys and a confidence band come back matched against Riskscape's own address database.
Site Manager
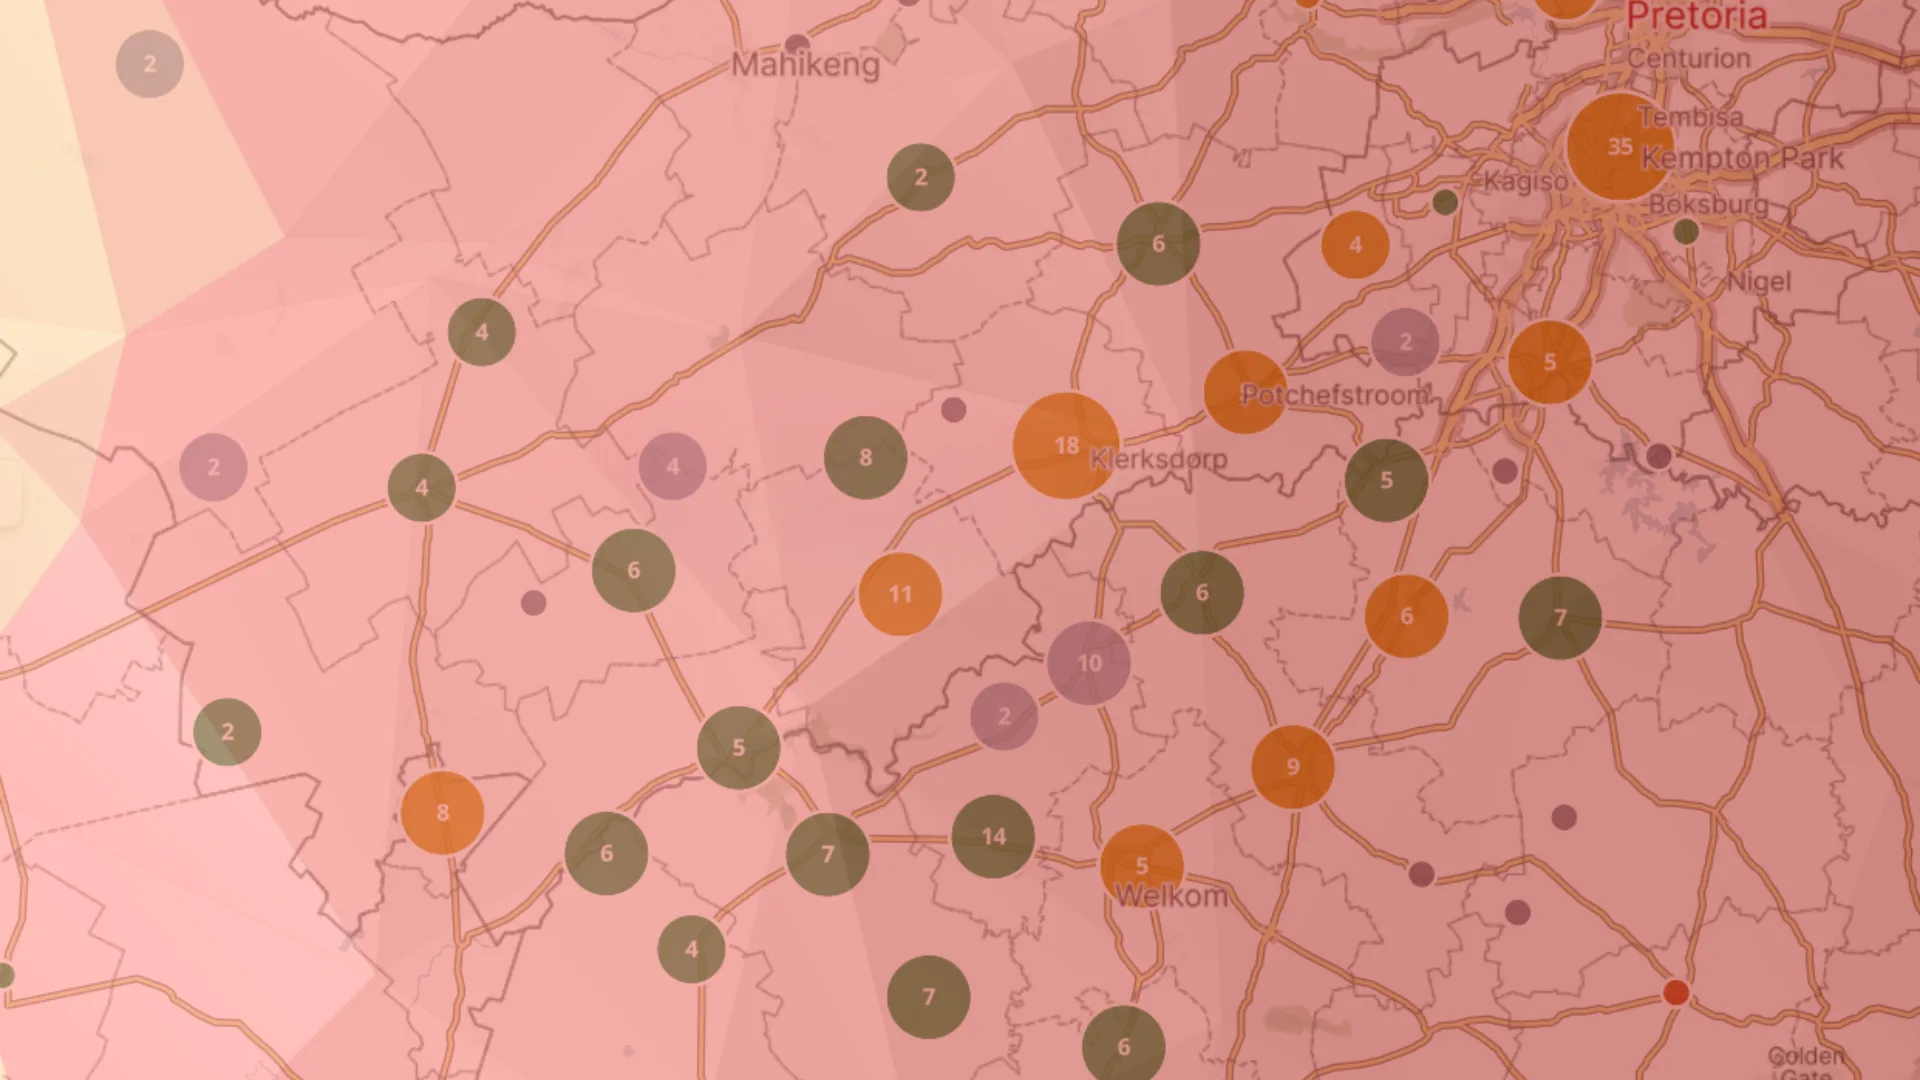
Live interactive map of the full portfolio. Every site plotted, clustered by proximity and colour-classified by any asset, area or risk dimension, switched in real time.
Asset & area reports
One-click PDF for a single site or a whole area, structured for underwriters, credit committees, engineers and auditors.
REST integration
Synchronous scoring into origination and pricing workflows, batch endpoints for portfolio runs, versioned response contracts.
Built from the ground up. Literally.
Every other platform in this market assembles someone else's layers. Riskscape owns the chain from aerial capture to the number on your screen. That is why we can tell you how a figure was produced, and change it when the evidence changes.
Go deeper.
Each part of ALR has its own page - what it holds, how it is built and where it is used.
See your own portfolio on the map.
Send us a sample of your sites, or an extract of your customer book, and we will run it through ALR before the call. The demonstration is then your assets, your locations and your risk, not ours.